Where Is Your Database Really Spending Its Time?
Have you ever investigated which SQL statements are unexpectedly slowing down your database?
With the IBExpert Full Version or Day Edition, you can see what is happening directly on the Firebird server. Simply right-click your registered database, select Start trace session, and enable tracing for your current connection. You can then follow statement preparation and execution, stored procedure calls, and trigger activity as they happen.
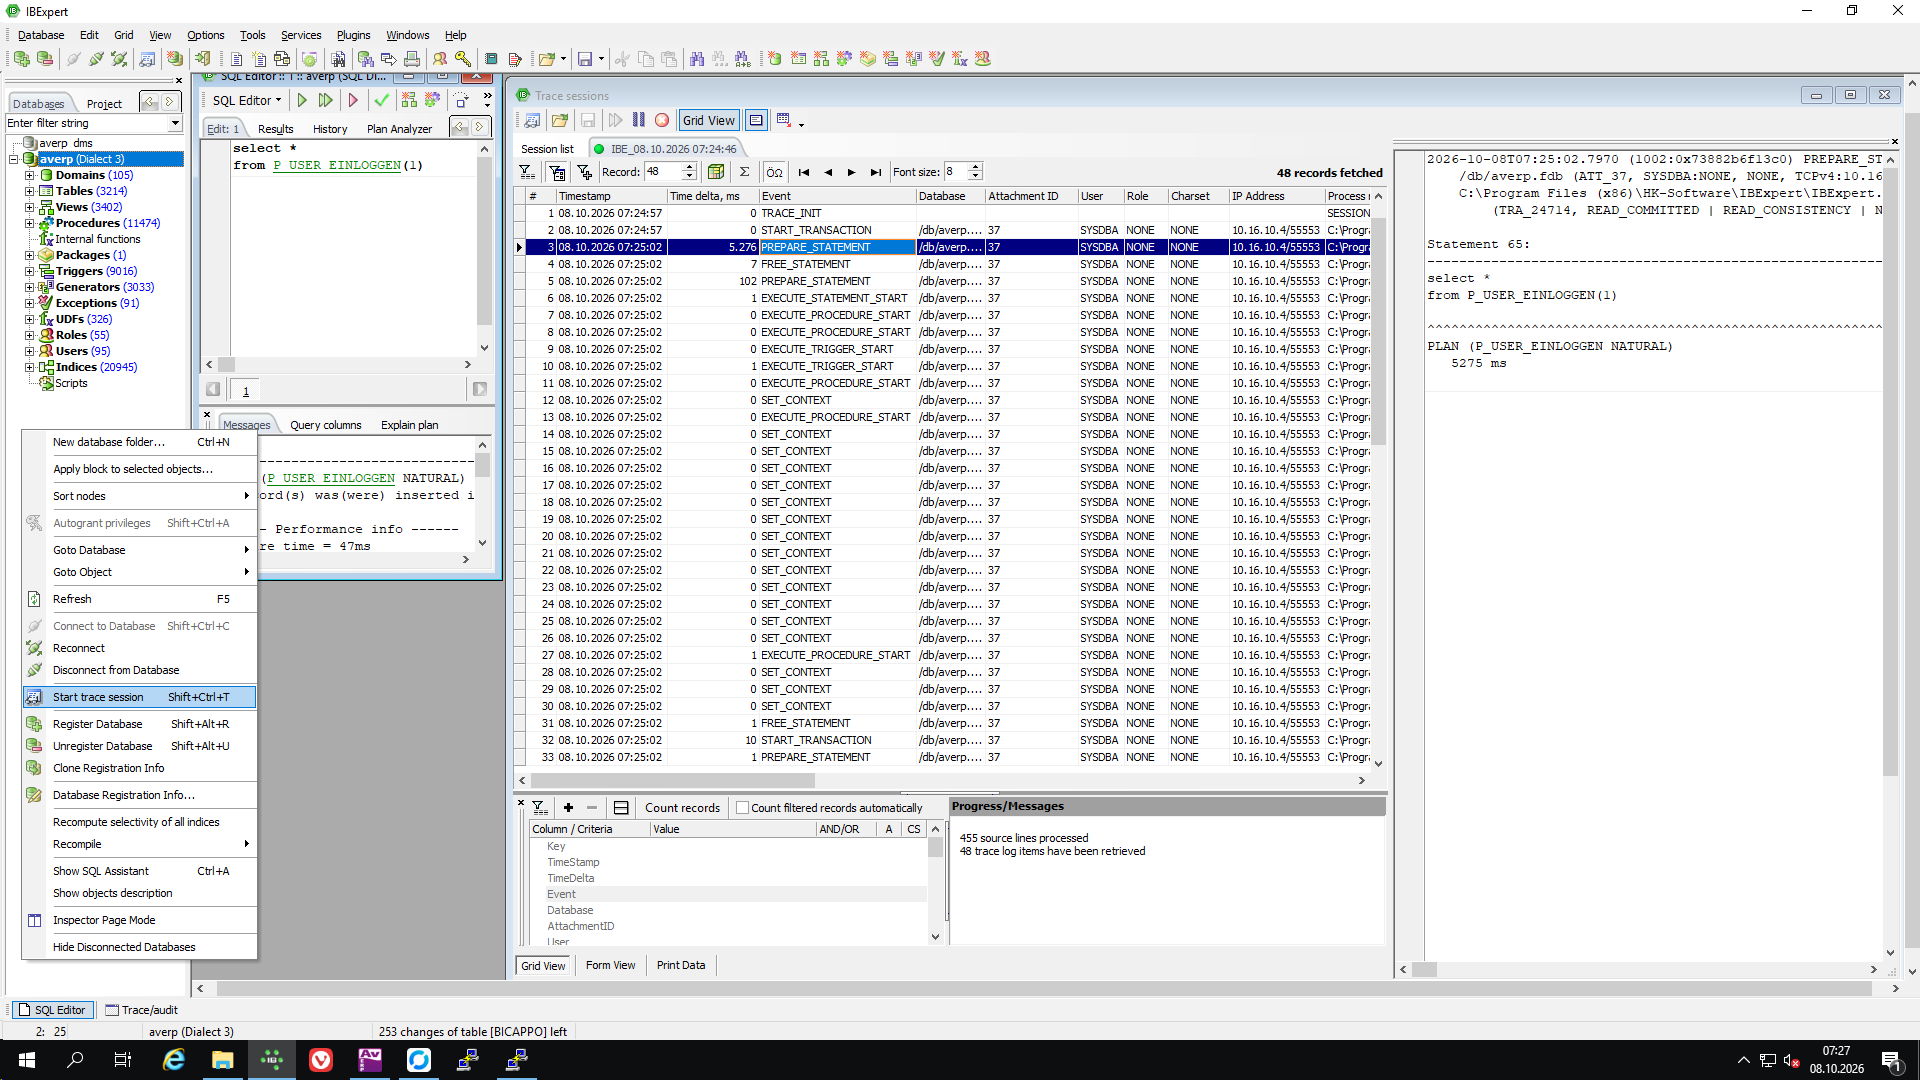
In the example shown, the seemingly unremarkable stored procedure P_USER_EINLOGGEN takes more than five seconds just to prepare the call, before execution even begins. A simple-looking SQL statement can hide a surprising amount of work.
These detailed trace results also give AI platforms the evidence they need to help you investigate performance problems and suggest targeted improvements. Without tools that reveal what the server actually does, even AI-assisted optimisation can quickly reach a dead end: the SQL text alone often does not explain where the time goes.
During our IBExpert Hotline Sessions, we can investigate these delays together, identify unexpected calls and dependency chains, explain why they occur, and work on ways to optimise your database.
Bring your trace results, and let’s find out where the time really goes.