IBExpert toolbars
<< Addenda? | IBExpert | Firebird License Agreement >>
- Database
- Edit
- Tools
- New Database Objects
- Domain Editor
- Table Editor
- View Editor
- Procedure Editor
- Debug Procedure
- Trigger Editor
- Generator Editor
- Exception Editor
- SQL Editor
- Navigation
- Filter Panel
- SQL Query Builder (Visual Query Builder)
- Data Analysis (PivotCube Form)
- Script Executive
- Dependencies Viewer
- SP/Triggers/Views Analyzer
- Extract Metadata
- Print Metadata
- Grant Manager
- Grants
- Localize IB Messages
- Localize IBExpert
- Report Manager
- Blob Viewer/Editor
- Database Designer
- ODBC Viewer
- Server Properties/Log
- Database Statistics
The individual IBExpert toolbars are described in detail in this section.
Should you ever experience problems with any of the toolbars in IBExpert, simply delete IBExpert.tb, found in Documents and Settings\<user>\Application Data\HK-Software\IBExpert and then restart IBExpert. A "lost" toolbar can be made visible again by altering the parameter Visible=0 to Visible=1 in IBExpert.tb, for example:
 [TSQLScriptForm.bm.Bar0]
 Caption=SQL Editor
 ...
 Visible=1
Toolbar Database
This standard toolbar can be viewed in the main IBExpert window. It can be blended in and out using the IBExpert View Menu / Toolbar (check boxes).
The icons (from left to right) can be used to execute the following operations:
- Register Database [Shift + Alt + R]
- Unregister Database [Shift + Alt + U]
- Connect to Database [Shift + Ctrl + C]
- Disconnect from Database [Shift + Ctrl + D]
- Reconnect to Database
- Create Database
- Exit [Alt + F4]
These items can also be found in the main IBExpert Database menu. To alter, customize or reset this toolbar, please refer to Toolbars.
Toolbar Edit
This standard toolbar can be viewed in the main IBExpert window. It can be blended in and out using the IBExpert View Menu / Toolbar (check boxes).
The icons (from left to right) can be used to execute the following operations:
- Load from File [Ctrl + L]. The downward arrow produces a drop-down list of the most recent files.
- Save to File [Ctrl + S]. The downward arrow produces a drop-down list of the most recent files.
- Cut [Ctrl + X]
- Copy [Ctrl + C]
- Paste [Ctrl + V]
- Find [Ctrl + F]
- Search again [F3]
- Replace [Ctrl + R]
These items can also be found in the main IBExpert Edit menu. To customize or reset this toolbar, please refer to Toolbars.
Toolbar Tools
This standard toolbar can be viewed in the main IBExpert window. It can be blended in and out using the IBExpert View Menu / Toolbar (check boxes).
The icons (from left to right) can be used to execute the following operations:
- SQL Editor [F12]
- New SQL Editor [Shift + F12]
- Query Builder
- Script Executive [Ctrl + F12]
- SQL Monitor [Ctrl + M]
- Search in Metadata [Shift + Alt + F]
- Extract Metadata
- Print Metadata
- User Manager
- Grant Manager
- Report Manager
- Blob Viewer/Editor
These items can also be found in the main IBExpert Tools menu. To customize or reset this toolbar, please refer to Toolbars.
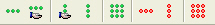
Toolbar New Database Objects
This standard toolbar can be viewed in the main IBExpert window. It can be blended in and out using the IBExpert View Menu / Toolbar (check boxes).
The icons (from left to right) can be used to execute the following operations:
- New Domain
- New Table
- New View
- New Procedure
- New Trigger
- New Generator
- New Exception
- New UDF
- New Role
These items can also be found in the main IBExpert Database menu, or in the IBExpert DB Explorer by clicking the right mouse key to offer a context-sensitive option for the selected database object. Alternatively [Ctrl + N] can be used in the DB Explorer to create new objects (providing an object type has been selected).
To customize or reset this toolbar, please refer to Toolbars.
Toolbar Domain Editor
The standard toolbar for the Domain Editor includes the following icons:
These can be blended in and out by clicking the downward arrow to the right of the toolbar, and using the menu item Add or Remove Buttons to check the relevant icons in the menu list.
To customize or reset this toolbar, please refer to Toolbars.
Toolbar Table Editor
The standard toolbar for the Table Editor includes the following icons:
These can be blended in and out by clicking the downward arrow to the right of the toolbar, and using the menu item Add or Remove Buttons to check the relevant icons in the menu list.
To customize or reset this toolbar, please refer to Toolbars.
Toolbar View Editor
The standard toolbar for the View Editor includes the following icons:
These can be blended in and out by clicking the downward arrow to the right of the toolbar, and using the menu item Add or Remove Buttons to check the relevant icons in the menu list.
To customize or reset this toolbar, please refer to Toolbars.
Toolbar Procedure Editor
The standard toolbar for the Procedure Editor includes the following icons:
These can be blended in and out by clicking the downward arrow to the right of the toolbar, and using the menu item Add or Remove Buttons to check the relevant icons in the menu list.
To customize or reset this toolbar, please refer to Toolbars.
Toolbar Debug Procedure
The toolbar for the Debug Procedure Editor includes the following icons:
The icons (from left to right) can be used to execute the following operations:
- Debugger drop-down menu
- Drop-down list of registered databases
- Toggle breakpoint [F5]
- Reset [Ctrl + F2]
- Parameters [Shift + Ctrl + P]
- Run [F9]
- Pause [Ctrl + P]
- Skip statement
- Step Over [F8]
- Trace Into [F7]
- Run to cursor [F4]
- Debug mode (Careful or Fast)
To customize or reset this toolbar, please refer to Toolbars.
Toolbar Trigger Editor
The standard toolbar for the Trigger Editor includes the following icons:
These can be blended in and out by clicking the downward arrow to the right of the toolbar, and using the menu item Add or Remove Buttons to check the relevant icons in the menu list.
To customize or reset this toolbar, please refer to Toolbars.
Toolbar Generator Editor
The standard toolbar for the Generator Editor includes the following icons:
These can be blended in and out by clicking the downward arrow to the right of the toolbar, and using the menu item Add or Remove Buttons to check the relevant icons in the menu list.
To customize or reset this toolbar, please refer to Toolbars.
Toolbar Exception Editor
The standard toolbar for the Exception Editor includes the following icons:

The second Filter by option offers a list of filter options: Name, Text and Description.
These can be blended in and out by clicking the downward arrow to the right of the toolbar, and using the menu item Add or Remove Buttons to check the relevant icons in the menu list.
To customize or reset this toolbar, please refer to Toolbars.
Toolbar SQL Editor
This toolbar can be viewed in the Tools / SQL Editor dialog and includes the following icons:
The Query Manager icon allows you to move, remove and rename the most recently used queries.
Individual icons can be blended in and out by clicking the downward arrow to the right of the toolbar, and using the menu item Add or Remove Buttons to check the relevant icons in the menu list.
It is also possible to quickly change the Transaction Isolation Level (TIL) for a separate SQL Editor. There is a corresponding button on the right-hand side of the SQL Editor toolbar which allows selection of one of the following isolation levels: Snapshot, Read committed, Read-only table stability, Read-write table stability.
To customize or reset this toolbar, please refer to Toolbars.
Toolbar Navigation
The navigational toolbar can be found on the Table Editor's Data page, the View Editor's Data page and in the SQL Editor on the Results page and includes the following icons:

The icons (from left to right) can be used to execute the following operations:
- Apply filter [Ctrl + Alt + A]
- Show Filter Panel [Ctrl + Alt + F]
- Quick Add Filter Criteria
- Record Number
- Data Analysis
- Show summary footer
- Display data as Unicode [F3]
- First
- Previous
- Next
- Last
- Insert
- Delete
- Edit
- Save Updates
- Cancel Updates
- Refresh
To the right the number of records fetched is displayed.
Toolbar Filter Panel
The Filter Panel toolbar can be found on the Table Editor's Data page, the View Editor's Data page and in the SQL Editor on the Results page when the Show Filter Panel is activated, and includes the following icons:

The icons (from left to right) can be used to execute the following operations:
- Apply Filter [Ctrl + Alt + A]
- Add New Criteria [Ins]
- Delete Criteria [Ctrl + Del]
- Vertical Layout [Shift + Ctrl + L]
- Count Records
- Count filtered records automatically (checkbox option)
Toolbar SQL Query Builder (Visual Query Builder)
This toolbar can be viewed in the Tools / SQL Query Builder dialog and includes the following icons:
These can be blended in and out by clicking the downward arrow to the right of the toolbar, and using the menu item Add or Remove Buttons to check the relevant icons in the menu list.
To customize or reset this toolbar, please refer to Toolbars.
Toolbar Data Analysis (PivotCubeForm)
This toolbar can be viewed in the Tools / Data Analysis dialog. The icons (from left to right) can be used to execute the following operations:
To customize or reset this toolbar, please refer to Toolbars.
Toolbar Script Executive
This toolbar can be viewed in the Tools / Script Executive dialog and includes the following icons:
The first item on the left, the drop-down menu detailing the most important operations, also includes the all-important Add CONNECT statement.
To alter, customize or reset this toolbar, please refer to Toolbars.
Toolbar Dependencies Viewer
This toolbar can be viewed in the Tools / Dependencies Viewer dialog and includes the following icons:

- Refresh
- Clear All
- Stop
- Max level
- Don't check domain dependencies (checkbox)
- Show domains [Ctrl + D]
- Show tables [Ctrl + T]
- Show views [Ctrl + V]
- Show triggers [Ctrl + R]
- Show procedures [Ctrl + P]
- Show generators [Ctrl + G]
- Show exceptions [Ctrl + E]
- Show UDFs [Ctrl + U]
These can be blended in and out by clicking the downward arrow to the right of the toolbar, and using the menu item Add or Remove Buttons to check the relevant icons in the menu list.
To customize or reset this toolbar, please refer to Toolbars.
Toolbar SP/Triggers/Views Analyzer
This toolbar can be viewed in the Tools / SP/Triggers/Views Analyzer dialog and includes the following icons:

| S | All SELECT statements are selected, analyzed and displayed. | |
| U | All UPDATE statements are selected, analyzed and displayed. | |
| I | All INSERT statements are selected, analyzed and displayed. | |
| D | All DELETE statements are selected, analyzed and displayed. | |
| P | Analysis of plans and indices. | |
| TC | Analysis of the compatibility of types of return values and variables for SELECT...INTO and OR SELECT...INTO statements. | |
| CW | Displays all compiler warnings. | |
| PK | Checks primary keys. |
Toolbar Extract Metadata
This toolbar can be viewed in the Tools / Extract Metadata dialog and includes the following icons:
These can be blended in and out by clicking the downward arrow to the right of the toolbar, and using the menu item Add or Remove Buttons to check the relevant icons in the menu list.
To customize or reset this toolbar, please refer to Toolbars.
Toolbar Print Metadata
This toolbar can be viewed in the Tools / Print Metadata dialog and includes the following icons:
The icons (from left to right) can be used to execute the following operations:
- Select database including a drop-down list of available databases.
- Preview
To alter, customize or reset this toolbar, please refer to Toolbars.
Toolbar Grant Manager
This toolbar can be viewed in the Tools / Grant Manager dialog and includes the following icons:
These can be blended in and out by clicking the downward arrow to the right of the toolbar, and using the menu item Add or Remove Buttons to check the relevant icons in the menu list.
To customize or reset this toolbar, please refer to Toolbars.
Toolbar Grants
This toolbar can be viewed in the Tools / Grant Manager dialog under Grants on, as well as in the Table Editor on the Grants page, and includes the following icons:
The icons (from left to right) can be used to execute the following operations:
- Grant All
- Grant All with GRANT OPTION
- Grant to All
- Grant to All with GRANT OPTION
- Grant All to All
- Revoke All
- Revoke from All
- Revoke All from All
Toolbar Localize IB Messages
This toolbar can be viewed in the Tools / Localize IB Messages dialog and includes the following icons:
The icons (from left to right) can be used to execute the following operations:
- Load from File
- Save to File
- Revert to original
- Go to line number
- Find text
- Find next
- Export to Text File
- Import from Text File
Toolbar Localize IBExpert
This toolbar can be viewed in the Tools / Localize IBExpert dialog and includes the following icons:

The icons (from left to right) can be used to execute the following operations:
- Save to File
- Find
- Search Again
- Export to Text File
- Import from Text File
- Font Charset (drop-down list)
Toolbar Report Manager
This toolbar can be viewed in the Tools / Report Manager dialog and includes the following icons:
These can be blended in and out by clicking the downward arrow to the right of the toolbar, and using the menu item Add or Remove Buttons to check the relevant icons in the menu list.
To customize or reset this toolbar, please refer to Toolbars.
Toolbar Blob Viewer/Editor
This toolbar can be viewed in the Tools / Blob Viewer/Editor dialog and includes the following icons:
These can be blended in and out by clicking the downward arrow to the right of the toolbar, and using the menu item Add or Remove Buttons to check the relevant icons in the menu list.
To customize or reset this toolbar, please refer to Toolbars.
Toolbars Database Designer
These toolbars can be viewed in the Tools / Database Designer dialog. They comprise vier individual toolbars and include the following icons:

Should IBExpert not load the toolbars automatically after starting the Database Designer, delete IBExpert.tb from the \Documents and Settings\<user>\Application Data\HK-Software\IBExpert\ directory and restart IBExpert.
The individual menus are as follows:
1. Palette
The icons (from left to right) can be used to carry out the following operations:
2. Main
3. Layout
4. Font / Colors
The icons displayed in the Main, Layout and Font / Colors toolbars can be blended in and out by clicking the downward arrow to the right of the toolbar, and using the menu item Add or Remove Buttons to check the relevant icons in the menu list. Custom colors are saved in and restored from a grc file.
To customize or reset these toolbars, please refer to Toolbars.
ODBC Viewer
The ODBC Viewer toolbar offers the following options:
- Display the active database connection type
- Run [F9] - runs an SQL
- Export data
- Exports data to script/file
- Cursor type: here a choice is offered of Forward Only, Static, Key Set, Dynamic.
To customize or reset this toolbar, please refer to Toolbars.
Toolbar Server Properties/Log
This toolbar can be viewed in the Services / Server Properties/Log dialog and includes the following icons:

- Select server (drop-down list of available servers)
- Retrieve
- Preview Log Report
To customize or reset this toolbar, please refer to Toolbars.
Toolbar Database Statistics
This toolbar can be viewed in the Services / Database Statistics dialog and includes the following icons:

- Select Database (drop-down list of available databases)
- Analyze from File
- Retrieve Statistic
- Preview Log Report
- Export
To customize or reset this toolbar, please refer to Toolbars.
See also:
Toolbar options
back to top of page
<< Addenda? | IBExpert | Firebird License Agreement >>


