Data Analysis / OLAP
<< Query Builder | IBExpert | Script Executive >>

Tutorial
The IBExpert Tools menu item, Data Analysis, is an ideal OLAP and data warehouse component for quickly and easily analyzing data in the database. This sophisticated module can be used to build cubes, manage dimensions and measures, the technology being based on the building of multidimensional data sets - so-called OLAP cubes. It includes a powerful filtering system, enabling not only dimensions but also measures to be filtered. This feature is unfortunately not included in the free IBExpert Personal Edition?.
The Data Analysis can be opened using the IBExpert Tools menu, or started directly from the SQL Editor / Results page, the Table Editor / Data page or the View Editor / Data page, using the Data Analysis icon:

Registering the DLL
When starting the Data Analysis for the first time, you may well get the message, Library zcube.dll was not found.
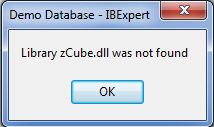
This is because this Data Analysis tool is provided as a separate DLL as part of the full IBExpert tool package, called zcube.dll, which you can find in the main IBExpert directory.
This simple Windows registration is performed automatically when you start IBExpert as Administrator. You only need to do this once; once registered you can use the Data Analysis even without Administrator rights. Please note, that with Windows it isn’t necessarily enough to be logged in as Administrator; you must right-click the desktop symbol, Start menu symbol or exe file and execute as administrator.
If you’re working with instances you may need to register it a second time.
Preparing data for analysis
We will illustrate the functionalities and options available in the Data Analysis, using the following simple SELECT command, executed in the SQL Editor:
SELECT * FROM SALES;
By clicking the Data Analysis icon on the SQL Editor / Results page, the Data Analysis module is opened:
The Data Analysis has its own toolbar (please refer to Data Analysis toolbar for further information), and contains two pages: Cube Structure and Cube.
Cube Structure
The first page has three main areas:
- All Fields: This automatically displays all data set fields displayed on the SQL Editor's Results page.
- Dimensions: what is to be analyzed and displayed. The field order is at this stage irrelevant.
- Measures: which values are to be analyzed and displayed. IBExpert Data Analysis permits use of any data types as measures; the only restriction being that non-numeric data types can only use the ctCount aggregate type.
As with all IBExpert grids, columns can be sorted in ascending and descending order by simply clicking on the column headers.
Fields can be selected from the All Fields panel and dragged 'n' dropped into the Dimensions panel. For example, CUST_NO, SALES_REP and SHIP_DATE, the shipping date also being grouped by month. The Alias names and Display Names can be manually altered as wished, and the Forecast Method and Wrap To periods can be selected from the pull-down lists. (Simply click on the field where a selection is to be made, and click the black downward arrow on the right of the field to open the list of available options.) Multiple field selection/deselection is also possible.
The TOTAL_VALUE field can be dragged 'n' dropped from the All Fields panel into the Measures area. Again select Calculation Type from the options offered in the pull-down list; the numeric Format can be manually altered if desired:
And then the cube can be generated using the Build Cube icon or [F9] (see illustration above) and displayed on the Cube Page:
Cube
The second page in the Data Analysis displays the cube itself in the third of four areas, so-called toolbars:
- Dimensions
- Columns
- Main display area
- Measures - the order of the items here determines how the data is displayed in the Data Analysis grid.
These areas can all be opened or closed, by clicking on the small square buttons in the upper left-hand corner of each area (see rectangular marked symbols in the illustration below). The arrow buttons can be used to adjust the size of the expanded areas, and display/hide the filter, which allows values to be searched and viewed for individual data sets.
The toggle toolbars on/off icon (see circled icon below) can be used to remove these areas completely leaving just the main blue display area, or blending them in again.
It is now possible to generate a summary, for example, which customer or which sales representative has generated which sales revenue. Or even which representative (column) has generated which revenue in which month:
The data can be displayed graphically with a simple mouse click on the desired graphics icon to the left of the Measures (here: Representative or Shipping Date (monthly)):
The Graphics window has its own mini toolbar, with the following options:
allowing the graph type to be altered, the legend and notes to be blended in or out, and the graph to be printed. There are numerous options to add functional values and formulae. Please refer to Cube Manager and Calculated Measures Manager for further information.
The generated data and analyses can be saved as *.CUB files, or exported to Excel (OLE), HTML or metafile. Simply click the small black arrow directly to the right of the Export icon, and select from the list:
They can even be quickly and easily printed - simply click the Print icon (or [Ctrl + P]), to go to the Print Preview, where the page layout and appearance may be modified before finally printing.
In fact, IBExpert's Data Analysis offers innumerable possibilities to define reports quickly and easily, or to simply collate the data material.
Data Analysis Cube Manager
The Cube Manager can be opened using the Data Analysis cube icon, or by clicking the Sum button in the bottom left hand corner of the Measures toolbar on the Cube page. This can be used to include certain alternative additional values. For example, alter the view to percentage column values:
Click the Apply icon to view the results:

Depending on what you wish to see, it is possible to specify an ascending or descending order by simply clicking on the column headers.
Data Analysis Calculated Measures Manager
It is possible to integrate certain function values by clicking on the Function button in the bottom left hand corner of the Measures toolbar on the Cube page, to open the Calculated Measures Manager.
You can add new measures and edit or delete existing measures.
A new measure name can be added by clicking the Add New Measure button and inserting a name. A template automatically appears in the Calculation Formula input area. This can be completed manually, the Available Measures (bottom left-hand list) and Available Views (bottom right-hand list) can be inserted simply by double-clicking on the measure name, or clicking the [upward arrow +] button to the right of the Available Measures or Available Views headings.
When you are satisfied with your specifications, simply click the

button. You will now see both the original evaluation and the new calculated measure name displayed in the status bar. By clicking the black arrow to the right of these names, the Cube Manager is automatically opened, displaying the specifications made for the selected measure.
Simply re-click the Function button to reopen the Calculated Measures Manager, to make additional alterations, insertions or deletions as required.
Preparing data quantities and automating with ibec_BuildCube
Creating a CUB file
Basically you can use the full range of SQL to define your data selection as a basis for Cube analysis. However you’re not going to want to sit down and write different complex SQLs every time someone in your enterprise needs to evaluate data. It is much more effective to define an SQL total data quantity with all the information that you may wish to view in various constellations.
By the way, IBExpert automatically saves your SQL every time you execute it and stores it in the SQL Editor’s History. So as long as you don’t overwrite it, you can go back to it and reuse it or tweak it as often as you like.
Then you can use the ibec_BuildCube script to automatically generate a cube once a week or once a month. You can define the Dimensions and Measures, and store the script on the network so that it is accessible to other staff, be it the Sales Director, CEO, or Controlling. When you click on this function name in the SQL Editor you can use the [F1] key to access the IBExpert online documentation, where you can simply copy the syntax and paste it in the SQL Editor:
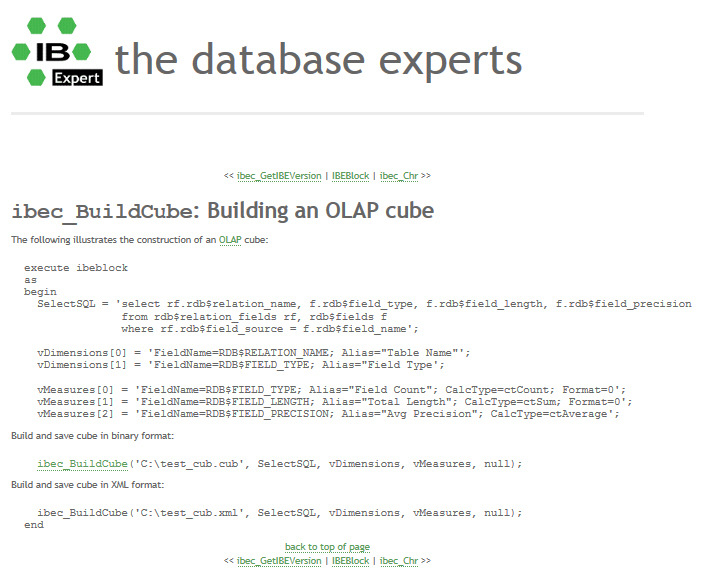
First write and test your SQL. Then copy the ibec_BuildCube script from the IBExpert online documentation and insert it into a new query.
Copy your SQL and insert it at SelectSQL =. Add, delete and amend dimensions, measures and parameters as necessary.
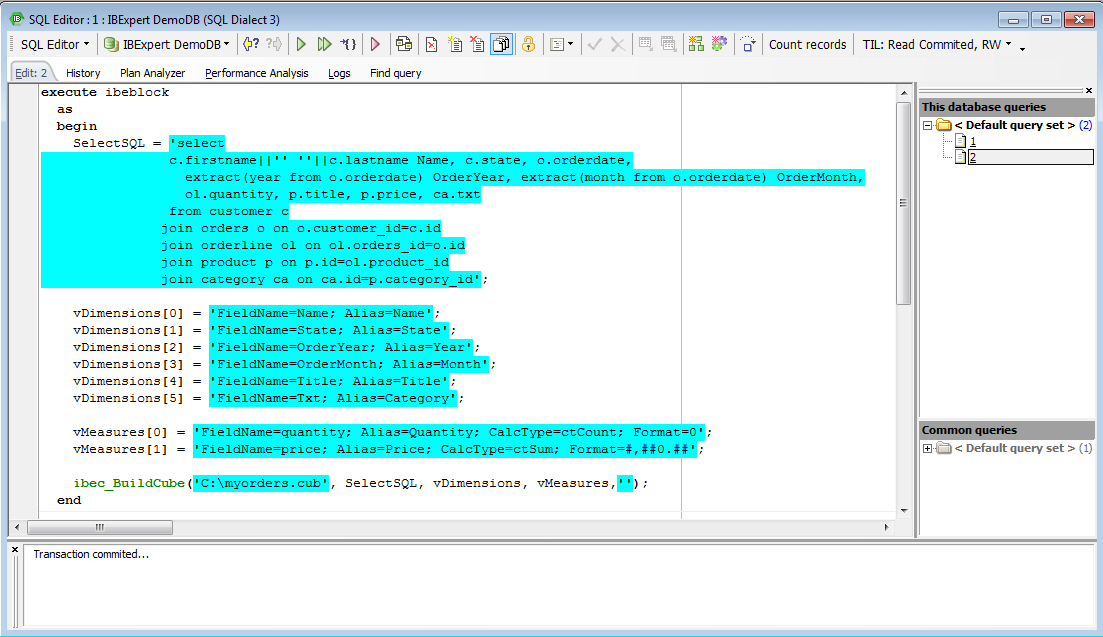
When you're happy with your script simply execute and commit to save your .CUB file.
Creating an IBExpert runtime version
These .CUB scripts can be provided to staff along with a slimmed down IBExpert version, which only has one menu item, Tools / Data Analysis. The Cube viewer needs absolutely no knowledge of IBExpert, Firebird or SQL. He merely needs to know where to find the CUB file, so that he can open it.
He can then decide which Dimensions and Measures to use, and view, print or export the resulting statistics. But he can’t make any alterations and he can’t access any database at all.
All you need to do to slim down this IBExpert version is generate a text file with this code:
  execute ibeblock as
  begin
    ibec_DisableFeature(0);	--disable all
    ibec_EnableFeature(1003);	--enable Tools menu
    ibec_EnableFeature(2148);	--enable menu item Tools -Data Analysis
  end
and file it under the name ibexpert.usr in the main IBExpert directory.
If you want to automate the installation process of this Cube Viewer version for your less computer-literate staff, you can use batch files to prevent each Cube user having to be given Administrator rights if he wants to start the program in a network environment. You will need a registered ibexpert.exe file, ibexpert.usr and zcube.dll for this.
Open the Windows input window as Administrator and go to the IBExpert directory (usually C:\Programs\HK-Software\IBExpert) where the zcube.dll stored and enter:
regsvr32 zcube.dll
Now when you start this limited IBExpert runtime version, you will see that the only menu item is Tools / Data Analysis.
You can now open the .CUB file and immediately view the data quantities in any constellation you wish.
You can use the Cube Manager to filter or add calculations to the data displayed, and you can generate graphics for all or part of any statistical summary.
You can go back and tweak your SQL as much as you like, until you really have all the data as you want it.
There are almost endless possibilities with the IBExpert Data Analysis; you can create a range of CUB files for the various departments in your enterprise to cover the requirements of sales, human resources, controlling etc.
back to top of page
<< Query Builder | IBExpert | Script Executive >>


